
Case Study
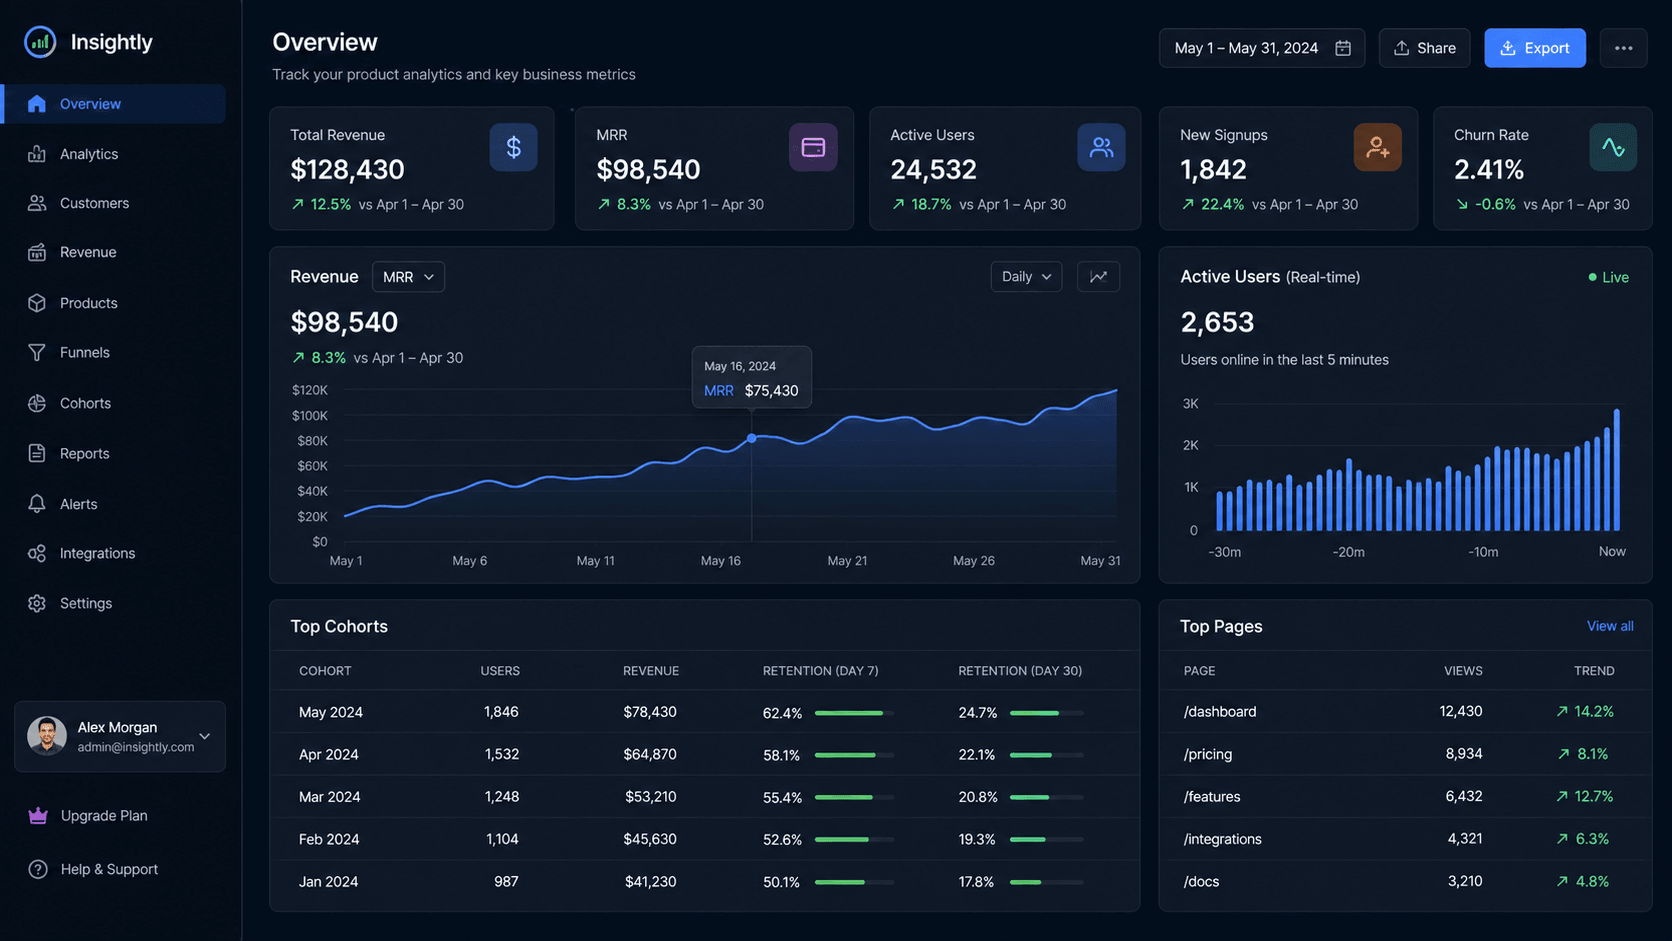
SaaS Analytics Dashboard
Multi-tenant analytics interface for product and growth teams.
Overview
A dashboard suite with trend analytics, cohort grids, and report workflows.
Problem
Teams lacked shared visibility into performance, retention, and adoption behavior.
Constraints
Needed role-aware analytics views across large datasets and tenant boundaries.
Solution
Implemented KPI cards, cohort visualization, and configurable reporting views.
Results and Outcomes
Improved frontend usability and created a scalable foundation for future analytics features.
Timeline
12-16 weeks
Services
Tech Stack
Related Services
Product Preview Mockup

SaaS
dashboard preview
Key Features
- • KPI cards
- • Revenue chart
- • Cohort grid
- • Trend indicators
- • Saved filters
Technical Approach and Architecture
- • Multi-tenant schema strategy
- • Caching for high-traffic widgets
- • Background aggregation workers
UI/UX Improvements
Introduced cleaner data hierarchy, filter persistence, and trend-focused layout.
Backend and Infrastructure Work
Designed aggregation jobs, caching strategy, and tenant-aware query boundaries.
Related Projects
AI
AI Industrial Intelligence Platform
AI-assisted operations dashboard for telemetry triage and issue routing.

AI
dashboard preview
Marketplace
Service Marketplace Platform
Service booking marketplace connecting demand, providers, and fulfillment.

Marketplace
marketplace preview
Fintech
Fintech Payment Platform
Secure payments platform with reconciliation visibility and risk controls.

Fintech
table preview